Financial data analysis is of the utmost importance for understanding your company’s financial health and future prospects. It involves analyzing numerous invoices, balance sheets, statements, and more in order to create a detailed report.
Thankfully, nowadays, there are different platforms that you can use to do the heavy lifting for you. However, you’ll need a robust, scalable, and secure environment to host one.
And we have the perfect one in mind.
In this article, we’ll discuss all the benefits Managed VPS hosting has in store for financial data analysis platforms.
Introduction to Managed VPS Hosting for Financial Data Analysis
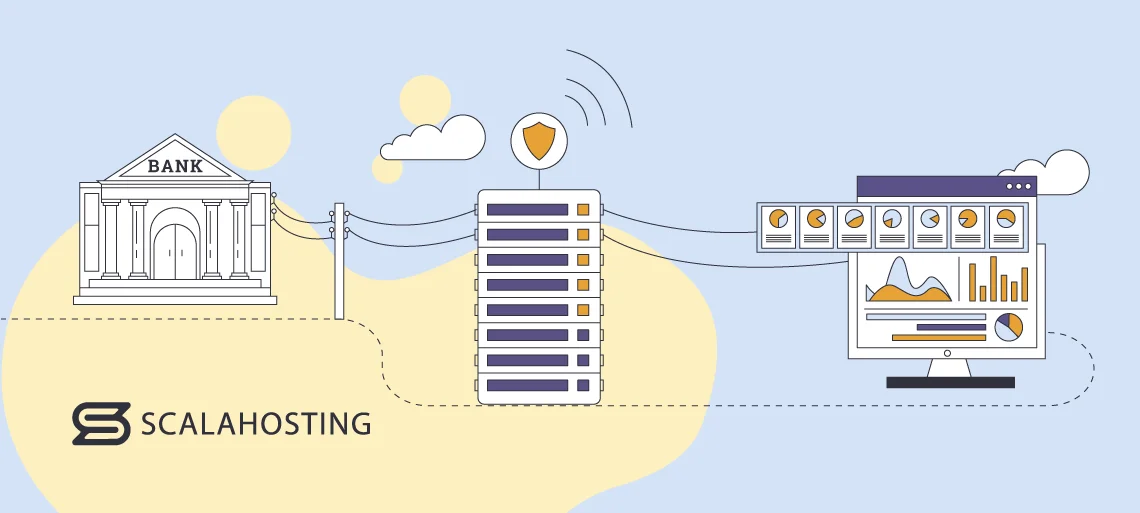
VPS (Virtual Private Server) hosting involves several people utilizing the same physical server in the form of virtual accounts. However, the main difference with shared hosting is that each user gets an isolated account with dedicated resources on a VPS package.
They operate independently, which offers better security, control, and performance compared to shared services. Plus, if you go for a managed virtual server option, you can rely on a team of experts to set up your account and keep an eye on it.
Another huge cloud VPS benefit – flexibility. You can add and remove server resources according to the current demand. Financial data analysis requires a lot of processing power, so being able to scale is vital.
Selecting the Right VPS Configuration for Financial Data Analysis
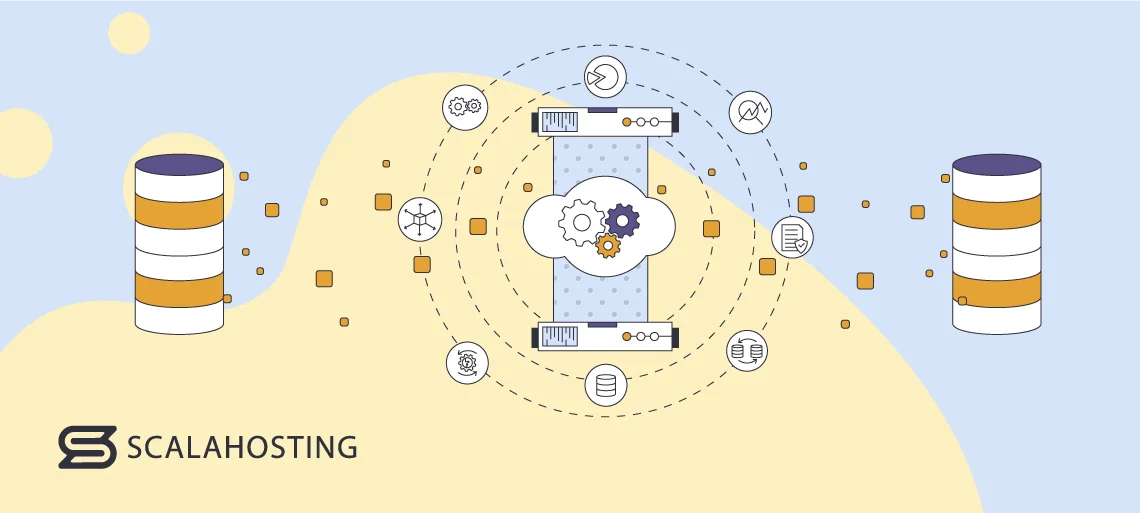
There are several factors to consider when you’re choosing your VPS configuration:
- CPU (Central Processing Unit) – a critical component for data analysis tasks. Multi-core processors and high clock speeds are great for handling parallel processing.
- RAM (Random Access Memory) – you need sufficient RAM for storing and quickly accessing data during analysis. The more extensive the dataset – the more RAM is required.
- Storage – you will need enough storage for quick data retrieval and report archiving.
- Network Requirements – a high-speed and reliable network connection is essential, especially when dealing with real-time financial data or accessing external data sources.
When signing up with a hosting vendor, you’ll need to have a clear idea about the resources you need. Financial data analysis platforms and apps are resource-heavy, so keep in mind you’ll need more processing power. Look for a provider that will enable you to scale easily if the need arises.
Managed VPS Hosting vs. Other Hosting Options for Financial Analysis
You can usually stumble upon four hosting types – shared, VPS, dedicated servers, and cloud.
On shared plans, multiple users share the same server and resources. While it’s a good option for those on a tight budget, it hides its risks. A single project can take over most of the resources, for example. Also, if one user gets blacklisted for things like spreading spam, all the rest on the same server will suffer.
You won’t have that issue with VPS hosting. Your account will be isolated, with its own resources and IP address. This means better security and optimized performance. You can also add more CPU cores, RAM, and storage space if your project requires it. That means you’ll only be paying for what you’re actually using. You get to tailor your plan to fit your exact needs.
With dedicated server hosting, you get the whole machine to yourself. You can enjoy complete control of the environment and are free to customize it as much as you want. You get as many resources as the server can handle. The big downside here is that you’ll have to pay steep monthly prices and fees for some needed extras.
All hosting packages can be powered by the cloud. Instead of being limited by one physical machine, you get a network of interconnected servers at your disposal. This brings some great advantages – optimized performance, maximized uptime, higher scalability, etc.
IMPORTANT: The cloud can power all types of hosting services. For example, there are regular VPS solutions and cloud VPS plans, with the latter carrying all the extras of the worldwide network of servers.
In terms of financial data analysis, VPS offers the best conditions. While that’s a resource-heavy project, you won’t need to be running it every month. That means you can host your platform on a cloud virtual server and add more resources when you need to perform the analysis. It’s the most budget-friendly yet effective option.
Financial Data Sources and Data Collection
In order to analyze your company’s financial data, you’ll first need to collect it. Start by defining your objectives and indicators. Then, start gathering:
- Records of financial transactions, including purchases, sales, and transfers.
- Available data about financial instruments, such as stock prices, exchange rates, and commodity prices.
- Info about the overall economic health, such as GDP, employment rates, and inflation.
TIP: Subscribing to data feeds from financial exchanges and institutions will enable you to receive continuous updates.
A good idea is to leverage Application Programming Interfaces (APIs) from financial data providers to retrieve real-time data. Examples include:
- Bloomberg Terminal – provides real-time financial data and analytics.
- Quandl – offers a vast array of financial and economic data through APIs.
- Yahoo Finance API – gives access to various financial data, including stock quotes and historical prices.
Tools and Software for Financial Data Analysis
Thankfully, the days of writing down financial data in a notebook and doing all the calculations manually are behind us.
There are quite a few tools that can take the burden off your shoulders, with the most popular ones being:
- R – A statistical programming language with a vast ecosystem of packages for financial analysis.
- Python – Widely used for data analysis and machine learning, with libraries like Pandas and NumPy.
- MATLAB – Preferred for quantitative analysis and modeling in finance.
- Excel – an all-time user favorite versatile tool for financial modeling and analysis, especially good for smaller datasets.
Once you’ve got the necessary data, you’ll need to visualize, analyze and present it. You can do so by using platforms such as Tableau. It enables interactive and visually appealing data visualization for financial reporting. Microsoft’s Power BI is another good option, as it has robust business intelligence capabilities.
Data Cleaning and Preprocessing
Preprocessing is the act of transforming the raw dataset into an understandable format. Techniques, such as normalization and feature scaling, contribute to better machine learning model performance.
Cleaning your data beforehand will ensure you remove errors, inconsistencies, and outliers, which is crucial for accurate financial analysis. It can also help you spot missing values and outliers, which are the data points that differ from the rest of the set. One way to detect them is to use the standard deviation of the data or the equivalent z-score.
Thankfully, the whole process of data preparation can be automated. A good option is to create designated data pipelines to streamline the cleaning and preprocessing operations. You can also utilize scripting languages like Python or R for automating repetitive data preparation tasks.
Data Storage and Databases for Financial Analysis
When performing financial analysis, you’ll need a way to keep the information.
Structured query language (SQL) is the most popular programming language for storing and processing data in a relational database. It enables users to perform daily tasks such as updating, inserting, deleting, and querying records. SQL databases have a predefined schema, which is like a blueprint of what your data will look like. While it is perfect for complex tasks, it can be a bit restrictive. Your data will need to follow the same structure, and any changes might lead to issues.
NoSQL databases, on the other hand, are built for specific purposes, which can include financial analysis. They feature dynamic schema for unstructured data that provides more flexibility.
Whichever one you choose, know that data indexing is a lifesaver. It optimizes query performance and enables you to keep everything in order. Also, make sure that each of your reports has a primary key, a tag for unique identification that will help you find data faster.
Security Measures for Financial Data
Security should always be a number one concern, no matter what platform or project you’re running. A financial data leak might jeopardize your whole company and bring devastating results.
One of the easiest ways to prevent leaks is to restrict access to financial information based on roles and responsibilities. That way, you can ensure that only trusted individuals can see your analysis.
You should also implement encryption protocols for data at rest and in transit to safeguard against unauthorized access. It scrambles all your information into a random assortment of letters and numbers. Common encryption protocols include TLS/SSL, SSH, Kerberos, etc.
There are also financial data security regulations you need to get familiar with. For example, GDPR (General Data Protection Regulation) ensures compliance with data protection regulations, particularly regarding the privacy of individual financial data.
When choosing your web host, be mindful of the security policies regarding your server and hosted project. After all, this is the foundation on which you’ll build your financial future.
Performance Optimization for Financial Analysis
Financial analysis requires a lot of data. This can slow down the process, which is the last thing you want. To avoid this, you can employ strategies such as:
- Parallel Computing – distributing computing tasks across multiple cores or processors for simultaneous execution.
- Distributed Systems – implementing distributed systems to handle large-scale data processing.
- Multi-Threading – utilizing multi-threading to execute multiple tasks concurrently.
Those will improve both the data analysis and the processing speed.
You can also accelerate the hardware. You can invest in a GPU (Graphics Processing Unit) for parallel processing, which is especially beneficial for machine learning that you can integrate into your analysis. Another option is FPGA (Field-Programmable Gate Array). This is a type of integrated circuit that can be configured to perform various tasks, including financial data analysis.
And, of course, choosing a managed cloud VPS package will help tremendously. This environment is extremely flexible, enabling you to add and remove resources whenever you need them.
Scalability and Handling Large Data Sets
Gathering your company’s invoices, balance sheets, statements, etc., and using the data to provide a structured financial report is no easy task. Thankfully, there are some strategies you can rely on that will make the whole process easier:
- Data Partitioning – dividing large datasets into smaller partitions for parallel processing.
- Distributed Computing – implementing frameworks like Apache Hadoop or Apache Spark for distributed data processing.
- Load Balancing – distributing workloads and content evenly across multiple servers to prevent bottlenecks.
Going for managed VPS hosting is another way to optimize your workflow. Your account will be completely isolated, which means there’s no need to worry about anyone else taking over your resources.
When the need arises, you’ll be able to scale up easily. Don’t worry about missing the right time to add more resources – the team of experts that’s taking care of your server will make sure to notify you if you’re hitting any limits.
Machine Learning and Predictive Analytics
Machine Learning (ML) will enable you to extract knowledge or find patterns in the available financial data. You can use it to forecast, improve your business stature, predict market demand, and more.
The most significant benefit is that AI enables quick, real-time, and dynamic forecasting in tune with the changing market conditions. You can also use machine learning to incorporate information from various sources. Those can include your company’s own financial reports, data feeds from financial exchanges and institutions, and even social media.
In order to help the AI generate more accurate forecasts, you’ll need to train its learning models on historical data. Thankfully, managed VPS hosting provides you with enough resources to do that.
You can employ both regression and classification models to help you with the analysis. The former will allow you to predict numerical outcomes, such as stock prices, while the latter is great for categorizing financial data into classes.
Time Series Analysis and Forecasting
Time series is the sequence of historical data points ordered in specific periods – daily, monthly, quarterly, or annually. The main benefit is that those help you predict future financial metrics.
There are three models you can use:
- Autoregressive (AR) – forecasts outputs by taking into consideration only past data. Best used for short-term predictions, such as quarter-to-quarter.
- Moving average (MA) – takes into consideration the average of historical data points during a specific period. Best used for predicting expenses, especially if they fluctuate.
- Autoregressive Integrated Moving Average (ARIMA) – a combination of AR and MA. Can be used on multiple occasions, like predicting yearly revenue growth.
You can use a dedicated tool to create a forecast report using time series analysis. The most popular option is Excel. It has both FORECAST and TREND functions, which are automated and minimize the risk of errors.
Real-Time Data Analysis and Trading
Real-time analytics enable you to get the latest information about financial markets, current trends, and possible trades. This requires a low-latency infrastructure, high-frequency trading strategies, and robust monitoring systems.
In this case, latency is the time delay between data generation and its processing. Look for a host with an advanced network architecture that has optimized its packages with speed in mind.
High-frequency trading (HFT) strategies leverage algorithms to analyze market data and execute trades within milliseconds. They often rely on quantitative models, statistical arbitrage, and algorithmic execution to capitalize on small price discrepancies. The top ones include:
- Statistical arbitrage – exploiting price discrepancies among currency pairs via statistical models.
- Market making – providing liquidity and getting profit from bid-ask spreads via continuous order placement.
- News-based trading – following important marketing events and releases to quickly capitalize on the short-term price movement.
- Scalping – leveraging rapid trades to benefit from small price changes in a matter of seconds.
One of the best ways to get information is from the data feeds of financial exchanges and institutions. Another good idea is to implement alerts for events like price threshold breaches and news sentiment shifts to help you stay on top of everything.
Managed VPS with ScalaHosting
With more than 15 years of experience in the web hosting world, ScalaHosting has created the perfect managed VPS plans for your financial data analysis journey.
With our plans, you can manage your resources in accordance with your needs. You can also rest assured that your company’s financial data is safe. All of our plans include the in-house developed SShield, blocking 99.998% of attacks before they even reach your server.
It is integrated into our very own hosting management platform – SPanel. It enables you to easily create SQL databases straight from your dashboard. You can also monitor your resource usage to know when it’s time to scale. Thanks to OpenLiteSpeed, all the necessary data will be loading fast.
In addition, all of our plans come with 24/7 support. Our team of experts will take care of your server and inform you when you need to scale. You can also set up daily off-site backups so that you won’t use any valuable information.
Contact us today to begin your hosting adventure!


Wrap Up
The environment that Managed VPS hosting provides the necessary performance, scalability, and security required for data-intensive tasks such as financial data analysis. Businesses can easily harness their full potential by choosing the right configuration and employing effective data vanalysis tools. And the best part – a team of hosting experts will have your back, taking care of all the technicalities, so you’ll have more time to deal with your company’s reports.
FAQ
Q: What is the difference between hosting and database?
A: To simplify, the difference between hosting and a database lies in the type of data that is being stored. Hosting vendors store your website files and serve them to users. A database is where your application data is stored and managed. Both are crucial for the seamless functioning of your website.
Q: What is web-based accounting software?
A: Web-based accounting software, also known as online or cloud accounting software, enables users to manage their financial transactions and accounting processes over the internet. The app is hosted on remote servers and accessed through a web browser. Examples include QuickBooks Online, Xero, and Zoho Books.
Q: What is an example of data analysis in finance?
A: You can use data analysis to create a financial performance report for your company. You’ll need to collect data, such as income and cash flow statements, structure it into a format of choice, and start calculating.
You can use key ratios, such as liquidity, profitability, and solvency, to assess the company’s financial health. Check the metrics to identify patterns or anomalies. This will help you create a business development strategy based on current results and future prospects.


